
MANA token showing charting signs of bullish run heading into February. January was a downward slope for the metaverse token. Price action shows resistance being challenged.
- On Saturday, Decentraland (Mana) expands the consolidated movements.
- Expect the rally to continue beyond the $2.50 to $3.0 demand zone.
- A breach below $2.03 would invalidate the bull’s hypothesis.
The price of Decentraland has remained stable at current levels, making a hammer candlestick on January 22. Although there is less purchasing activity in cryptocurrencies, they are still building a bullish setup. MANA/USD is now trading at $2.31, up 1.23 percent on the day. The current market capitalization of MANA is $4,304,417,127 USD, with a current circulation of 1,824,500,835 MANA coins and without maximum supply.
Decentraland (MANA) prepares for a U-turn
The price has been on a downward trend on the daily charts since testing the 50-day moving average on December 27. The price had already dropped from all-time highs of $5.91 on November 25, a total value drop of 48 percent. Investors challenged the $3.06 level three times, a support-turned-resistance level. As a result, it is a critical trading level.
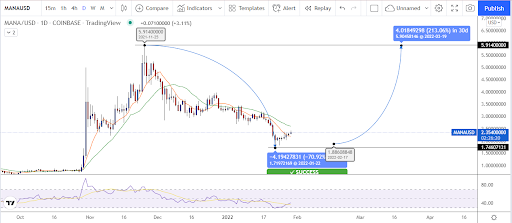 Source – TradingView
The daily relative strength index (RSI) is now trading at 38, with a bullish crossing suggesting that the pair is poised to go higher. The declining trend line from the stated line, which is at $2.50, is the immediate resistance.
Resistance & Support Levels are Critical for Upward Trend
In addition, the bulls would dig deep to reclaim the psychological $3.06 level. This will also coincide with the 50 DMA re-test. A clear break above this level might entice additional investors to join the renewed upward trend.
Conversely, the bullish thesis will be invalidated if the price falls below the $1.98 horizontal support line. The $1.50 level would be the objective for sellers. More fall is likely targeting the descending channel’s bottom trend line at 1.32. The last time these levels were witnessed was in October.
Get your Free “Beginners Guide to Crypto & Defi” Now