
The pricing action for Decentraland is looking like it will bottom before it makes a positive move. Price charts below tell the story. The bears are clawing now but the Bulls are getting to charge!
- Decentraland price is gearing up for a significant drop following a slice below a critical line of defense.
- MANA could be headed for $1.46 next, a target is given by the prevailing chart pattern.
- Decentraland may discover meaningful support at $1.92 before the sell-off continues.
Could Decentraland Slide Further?
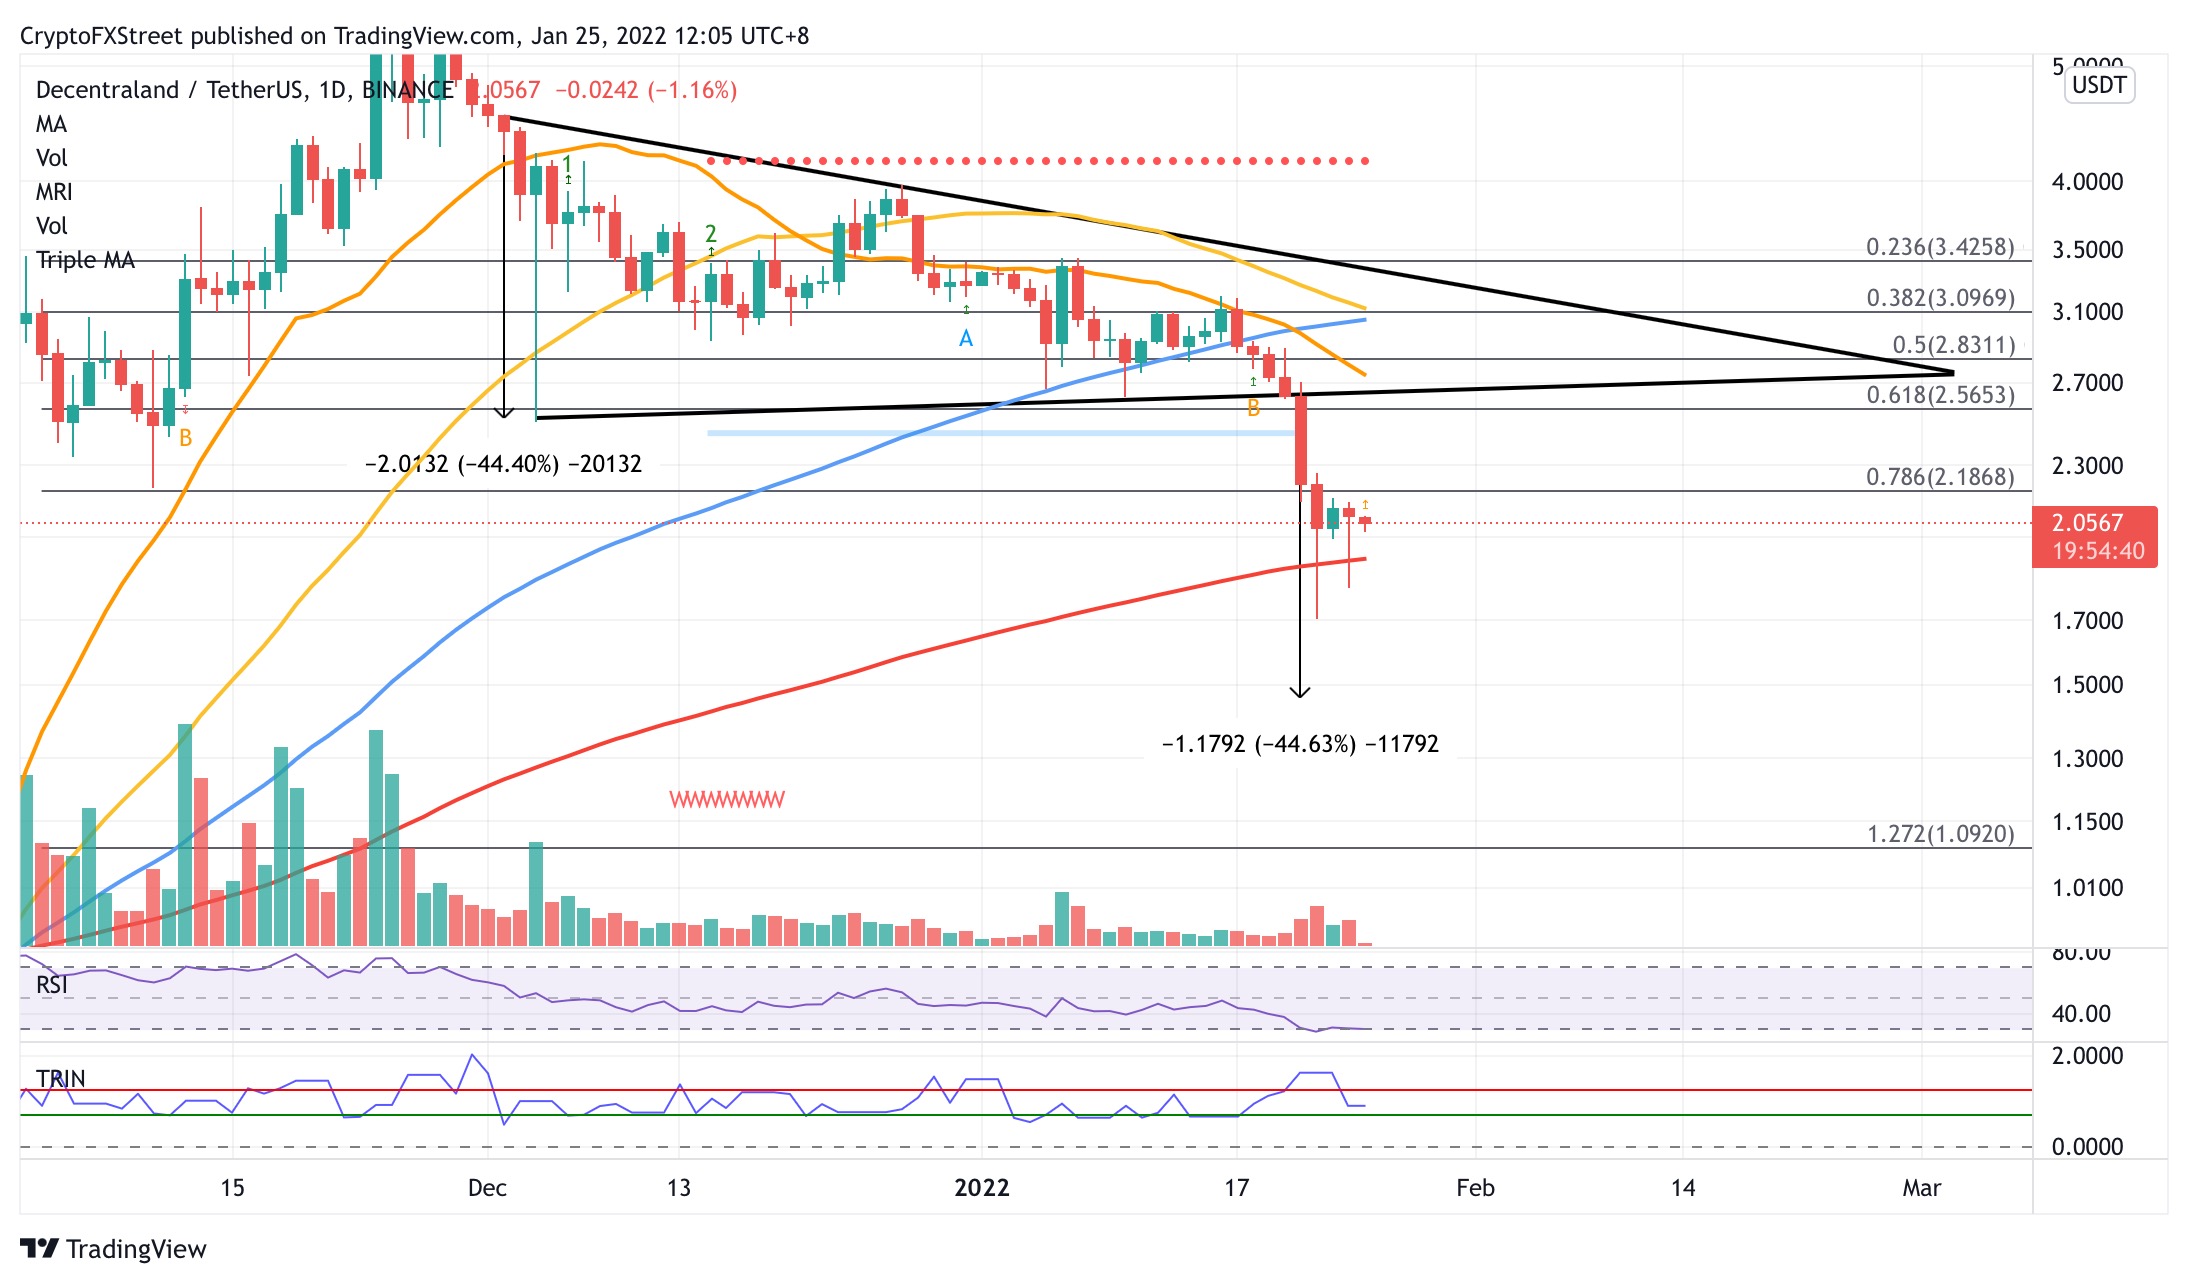
Decentraland price could be headed for a further decline as MANA continues to drop toward the bearish target projected by a pessimistic chart pattern. The token is at risk of a 28% plunge toward $1.46 if the 200-day Simple Moving Average (SMA) fails to act as a reliable foothold.
Decentraland price has formed a descending triangle pattern on the daily chart, putting a 44% nosedive toward $1.46 on the radar after MANA sliced below the lower boundary of the governing technical pattern on January 21.
More Decentraland Price News: Deceentraland Price Predictions
The token could continue dropping further as Decentraland price fell below the 78.6% Fibonacci retracement level at $2.18 on January 22 which acted as a line of defense for MANA.
Decentraland price should be able to tread above the 200-day SMA at $1.92, which acts as the next line of defense for MANA.
However, dropping below the aforementioned level of support may spell further trouble for the bulls, as the token is likely to fall further to reach the bearish target at $1.46, coinciding with the October 29 high.
Additional selling pressure may see Decentraland price plunge further toward the 127.2% Fibonacci extension level at $1.09.
 MANA/USDT daily chart
Buying Pressure Is Needed for Retracement
If buying pressure increases, Decentraland price will face immediate support-turned-resistance at the 78.6% Fibonacci retracement level at $2.18, then at the lower boundary of the governing technical pattern at $2.64, which sits near the 61.8% Fibonacci retracement level and 21-day SMA.
Decentraland price may be confronted with a stiff hurdle at $3.09, where the 38.2% Fibonacci retracement level is located. Padding this resistance is the 50-day SMA and 100-day SMA. Only a decisive break above this headwind would see MANA target bigger aspirations above the upper boundary of the prevailing chart pattern.
Get your Free “Beginners Guide to Crypto & Defi” here